

October 9, 2025
As we entered fall, inventory across the Seattle metro area remained high, while prices held steady and buyer demand rebounded. September’s data paints a picture of a market adjusting — not softening.
Buyers have more options and time to decide, yet well-priced homes continue to attract quick offers, especially in sought-after Eastside and Mercer Island neighborhoods.
Key Takeaways:
For Sale: 1,337 (+0.6% MoM | +58% YoY)
New Listings: 833 (+27.4% MoM | +20.9% YoY)
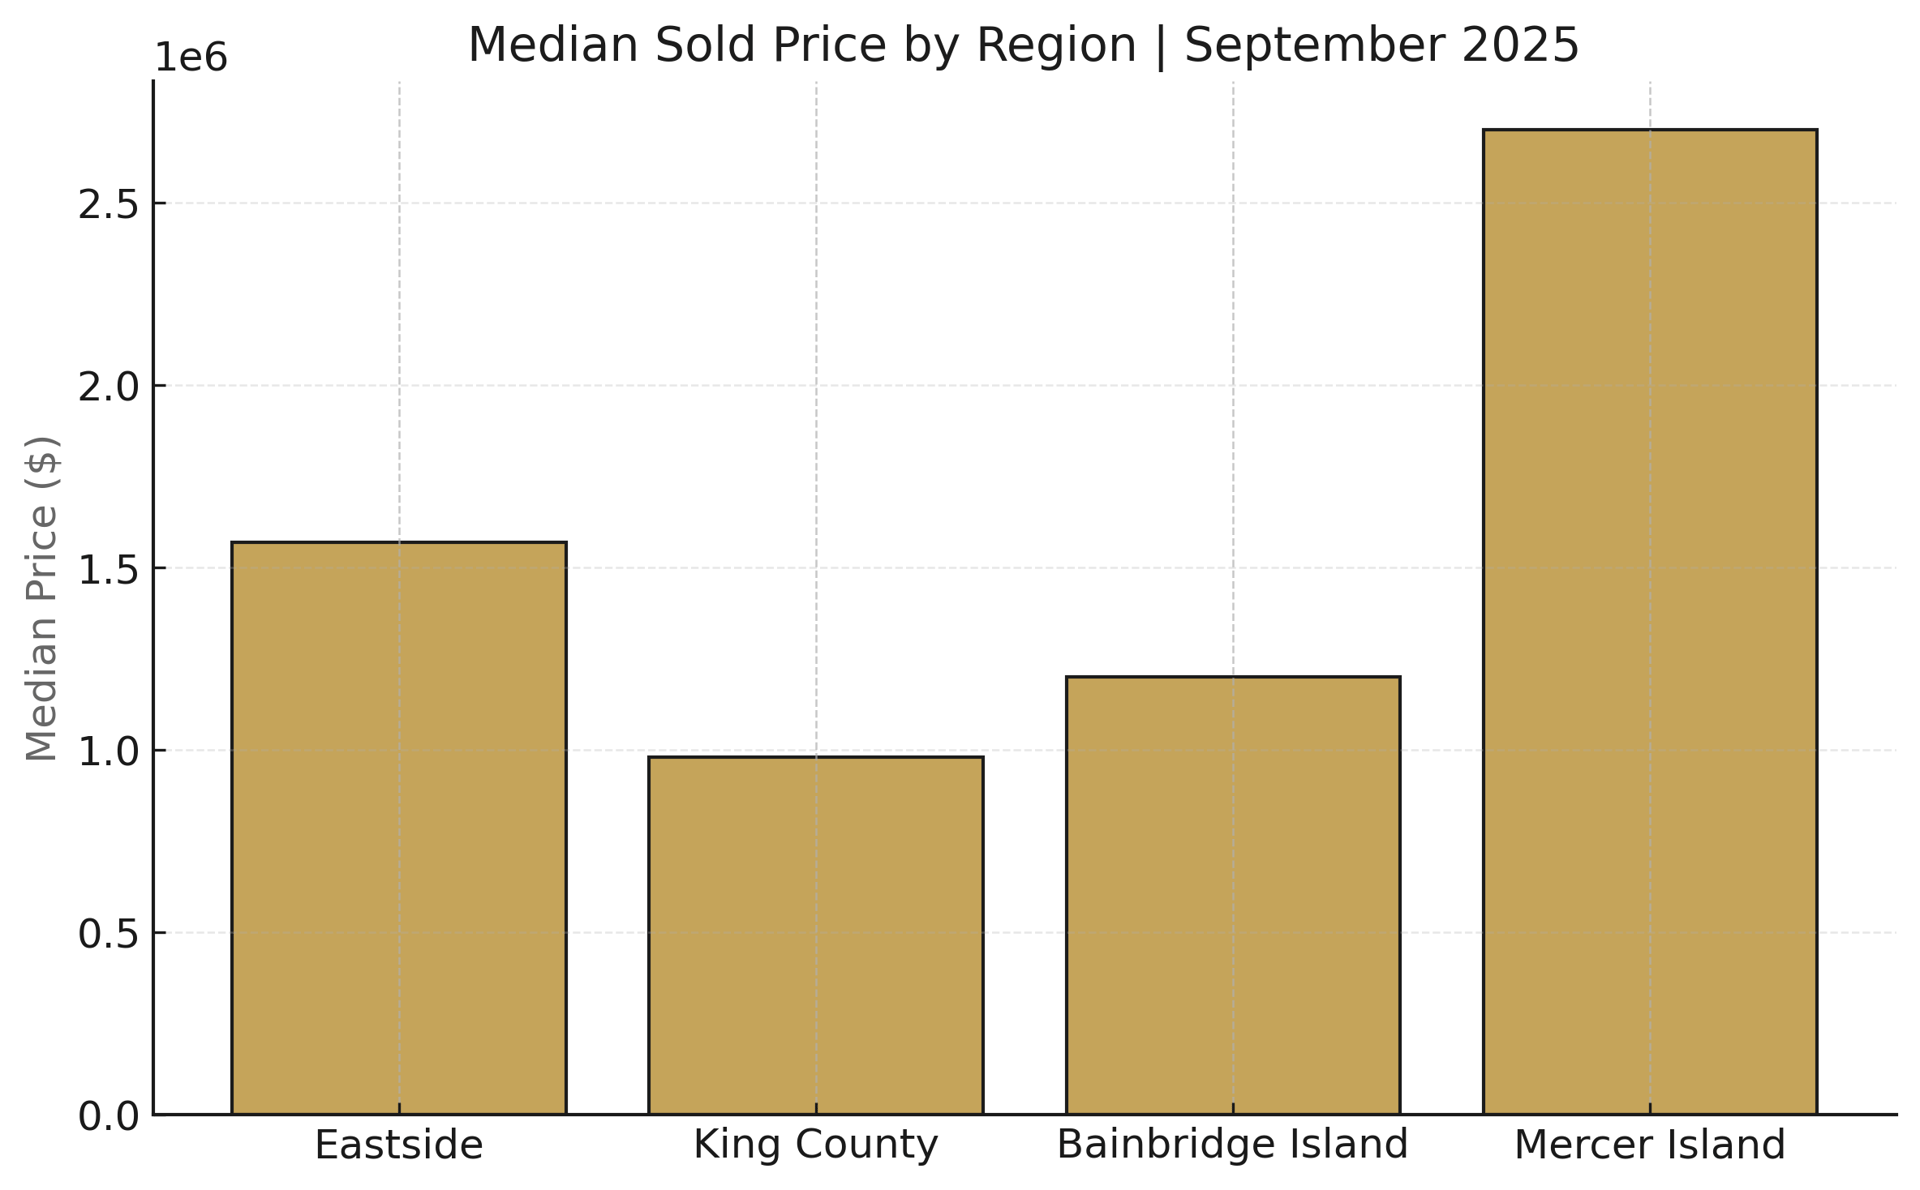
Median Sold Price: $1.57M (+1.1% MoM | +1.3% YoY)
Avg CDOM: 38 days (up 18.8% MoM | up 81% YoY)
Months of Inventory: 2.7 months (flat MoM | up 42.8% YoY)
📌 Summary:
Inventory is stabilizing at higher levels, giving buyers more choice and leverage. Homes are taking longer to sell, but pricing remains resilient. This is a balanced, strategic market.
Key Takeaways:
For Sale: 4,278 (+2.9% MoM | +26.5% YoY)
New Listings: 2,843 (+35.6% MoM | +15.2% YoY)
Median Sold Price: $980K (-0.5% MoM | +2.1% YoY)
Avg CDOM: 37 days (+15.6% MoM | +42% YoY)
🕰 Months of Inventory: 2.7 months (+8% MoM | +22% YoY)
📌 Summary:
King County remains active with rising new listings and modest price growth. Slightly longer market times reflect buyer caution rather than weakness. The market is healthy and more normalized.
Key Takeaways:
For Sale: 66 (-13.2% MoM | -23.3% YoY)
New Listings: 29 (-27.5% MoM | -19.4% YoY)
Median Sold Price: $1.2M (-11.3% MoM | -18.5% YoY)
Avg CDOM: 65 days (+27.5% MoM | +54.8% YoY)
Months of Inventory: 1.9 months (+5.7% MoM | -47.4% YoY)
📌 Summary:
Inventory is tightening again on Bainbridge, driving competition for well-priced homes even as prices recalibrate from last year’s highs. The island remains a niche, high-demand submarket.
Key Takeaways:
For Sale: 62 (+8.8% MoM | +24% YoY)
New Listings: 39 (+56% MoM | -9.3% YoY)
Median Sold Price: $2.7M (+27.9% MoM | +19.9% YoY)
Avg CDOM: 38 days (+26.7% MoM | +111% YoY)
🕰 Months of Inventory: 2.8 months (-17.9% MoM | flat YoY)
📌 Summary:
Mercer Island saw a September surge in sales prices and listings. Luxury demand remains strong, with top-tier properties moving despite longer market times.
For Buyers:
Inventory and longer days on market are giving you room to negotiate — but act strategically. If rates ease, competition will rise again this winter.
For Sellers:
Homes that show well and are priced right still move quickly. Presentation and timing are key to standing out amid growing supply.
For Brokers:
Encourage clients to stay data-driven. Market behavior varies sharply by submarket — local expertise and pricing precision are what win right now.

June 25, 2026

June 18, 2026

June 11, 2026

June 4, 2026

June 4, 2026

June 3, 2026

June 1, 2026

May 29, 2026

May 28, 2026
Whether buying or selling, Michele and her team deliver unmatched service, helping you find your dream home or maximize your property’s value. With a focus on building lifelong relationships, we make your real estate journey seamless and rewarding. You’re more than a transaction – you’re family. Let’s connect and get started today!